generated_time_series
R/time_series_model.R
plot.generated_time_series.Rd
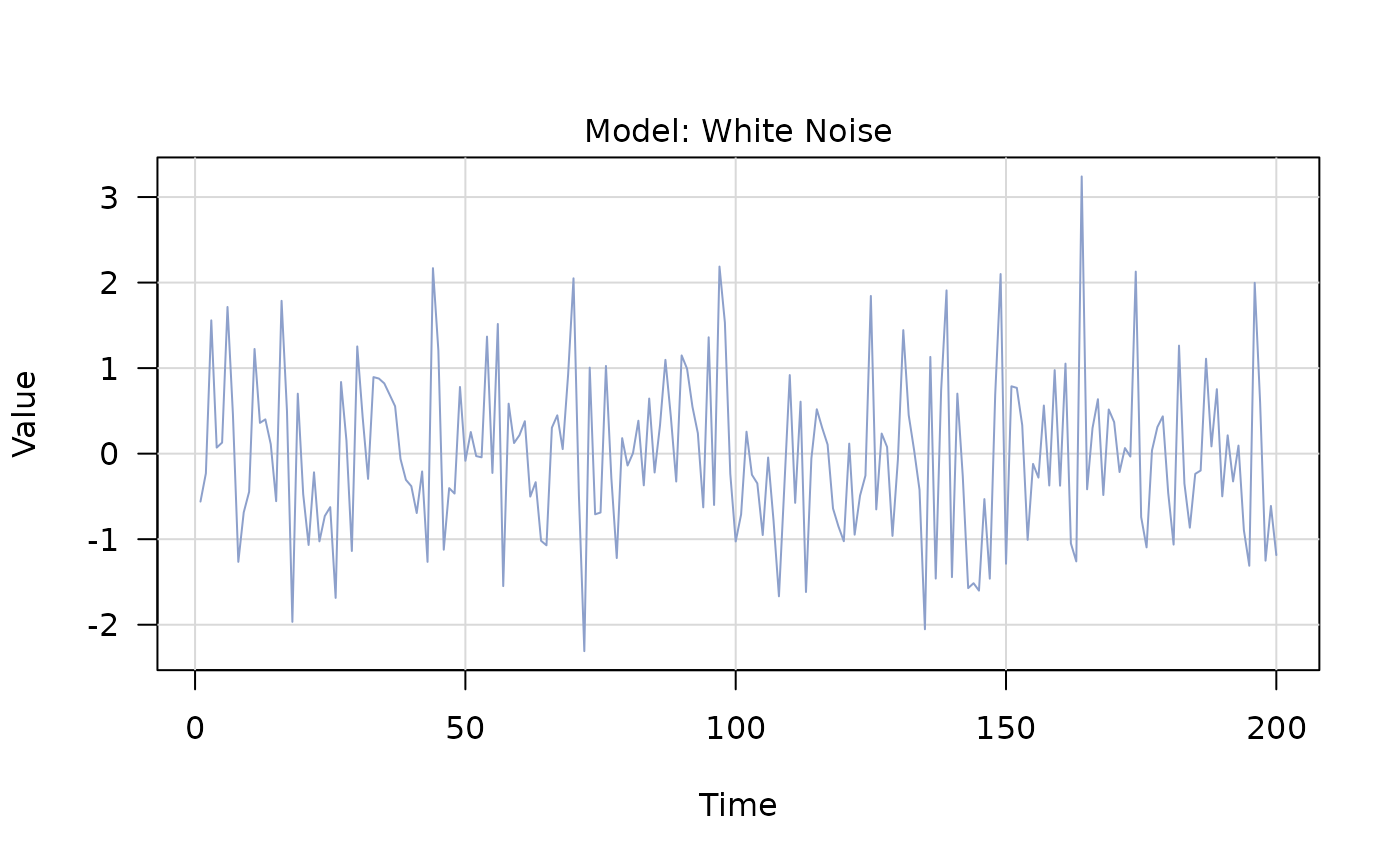
Produces a single line plot for a generated_time_series object.
# S3 method for class 'generated_time_series'
plot(x, ...)
A generated_time_series.
Additional arguments passed to plot().
plot()
Invisibly returns x.
x
m1 <- wn(sigma2 = 1)
y1 <- generate(m1, n = 200, seed = 123)
plot(y1)