Plot a generated_composite_model_time_series object
Source: R/time_series_model.R
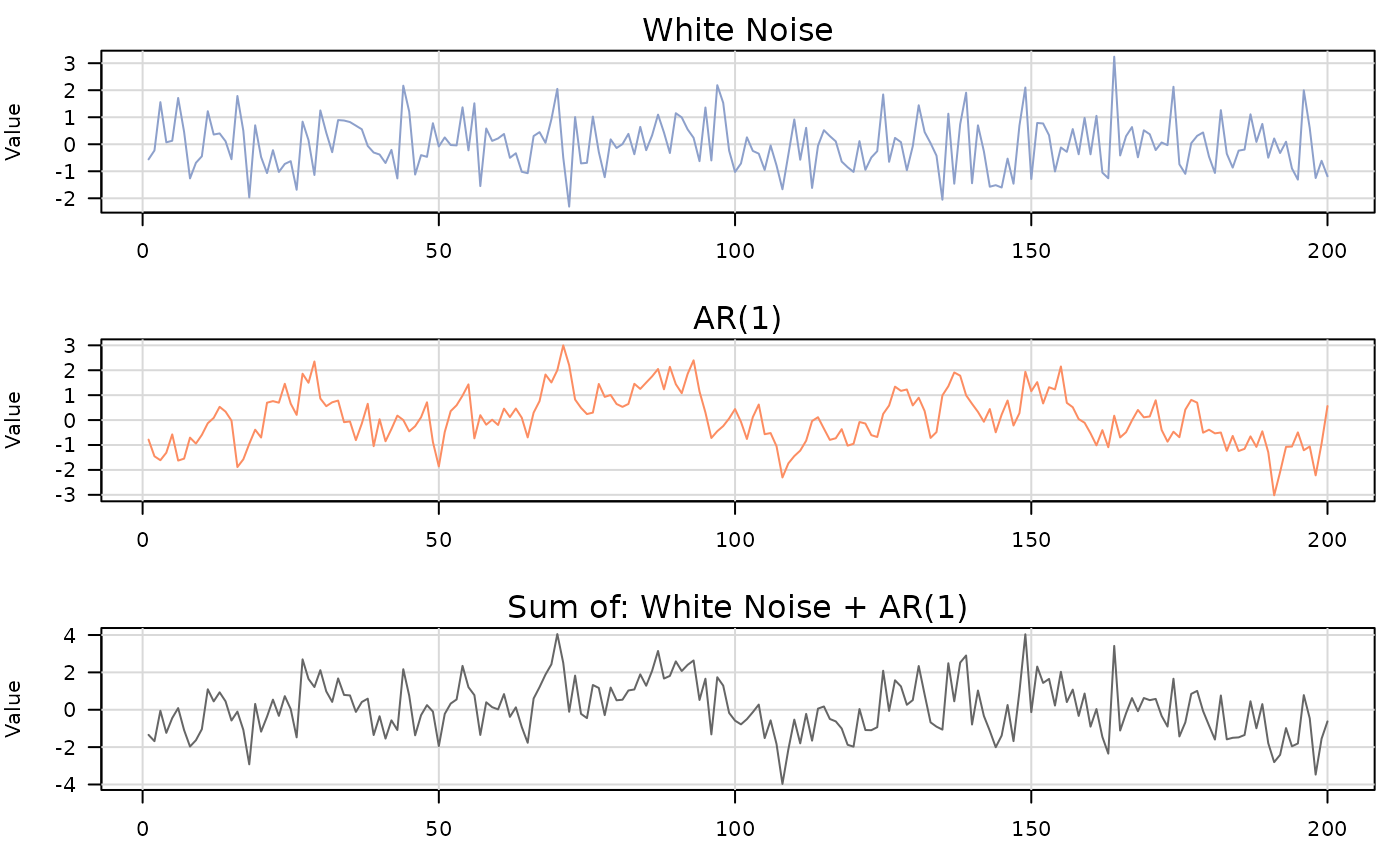
plot.generated_composite_model_time_series.RdProduces stacked line plots for each component and the sum for a
generated_composite_model_time_series object.
# S3 method for class 'generated_composite_model_time_series'
plot(x, ...)
Arguments
- x
A
generated_composite_model_time_series.- ...
Additional arguments passed to
plot().
Value
Invisibly returns x.