Plot a gnss_ts_ngl object
# S3 method for class 'gnss_ts_ngl'
plot(x, component = NULL, ...)
Arguments
Value
No return value. Plot a gnss_ts_ngl object.
Details
Calendar years are shown above each time-series panel, with spacing chosen automatically from the time span (approximately six labels). Modified Julian Dates are retained below.
Examples
station_1LSU <- download_station_ngl("1LSU")
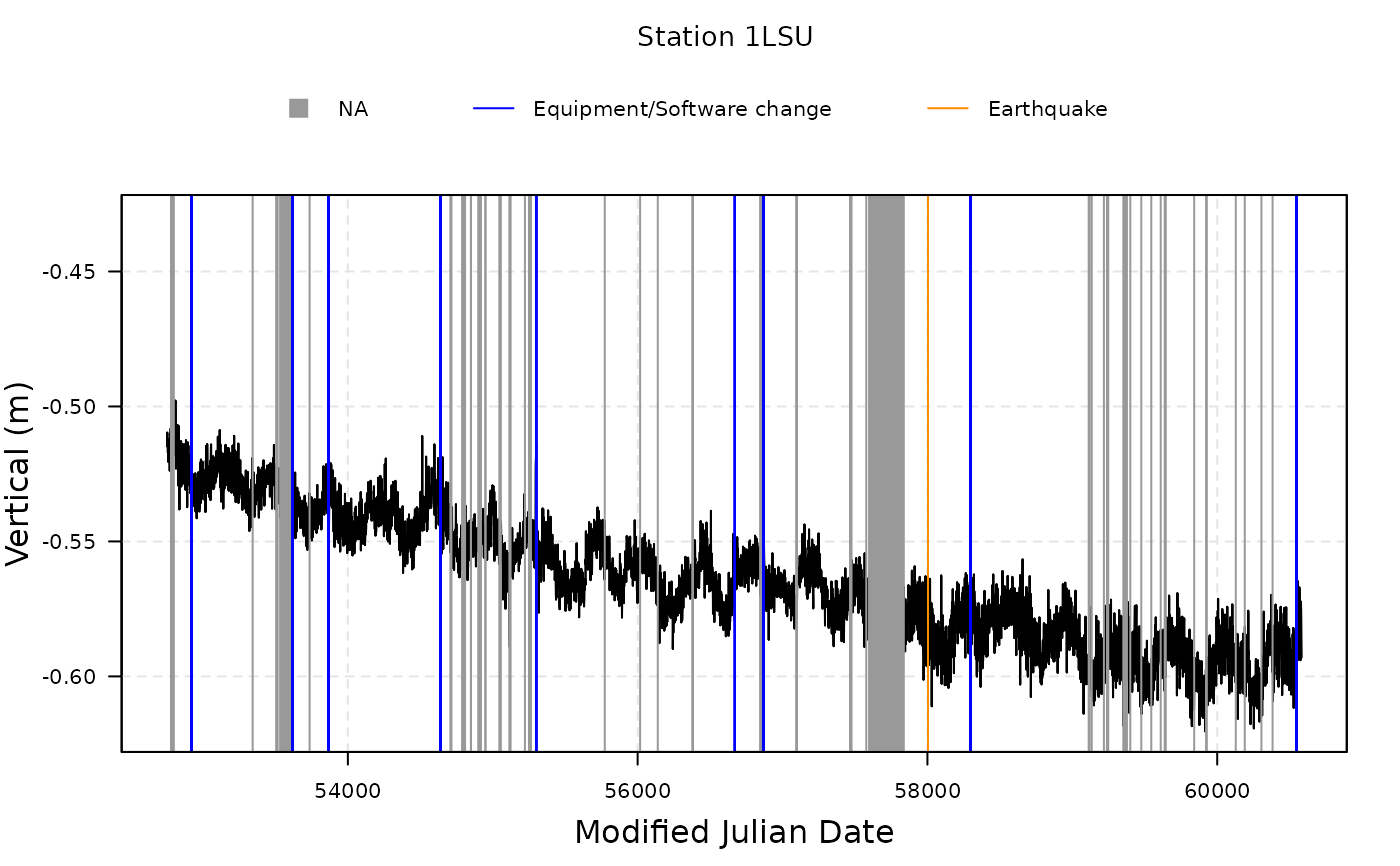
plot(station_1LSU)
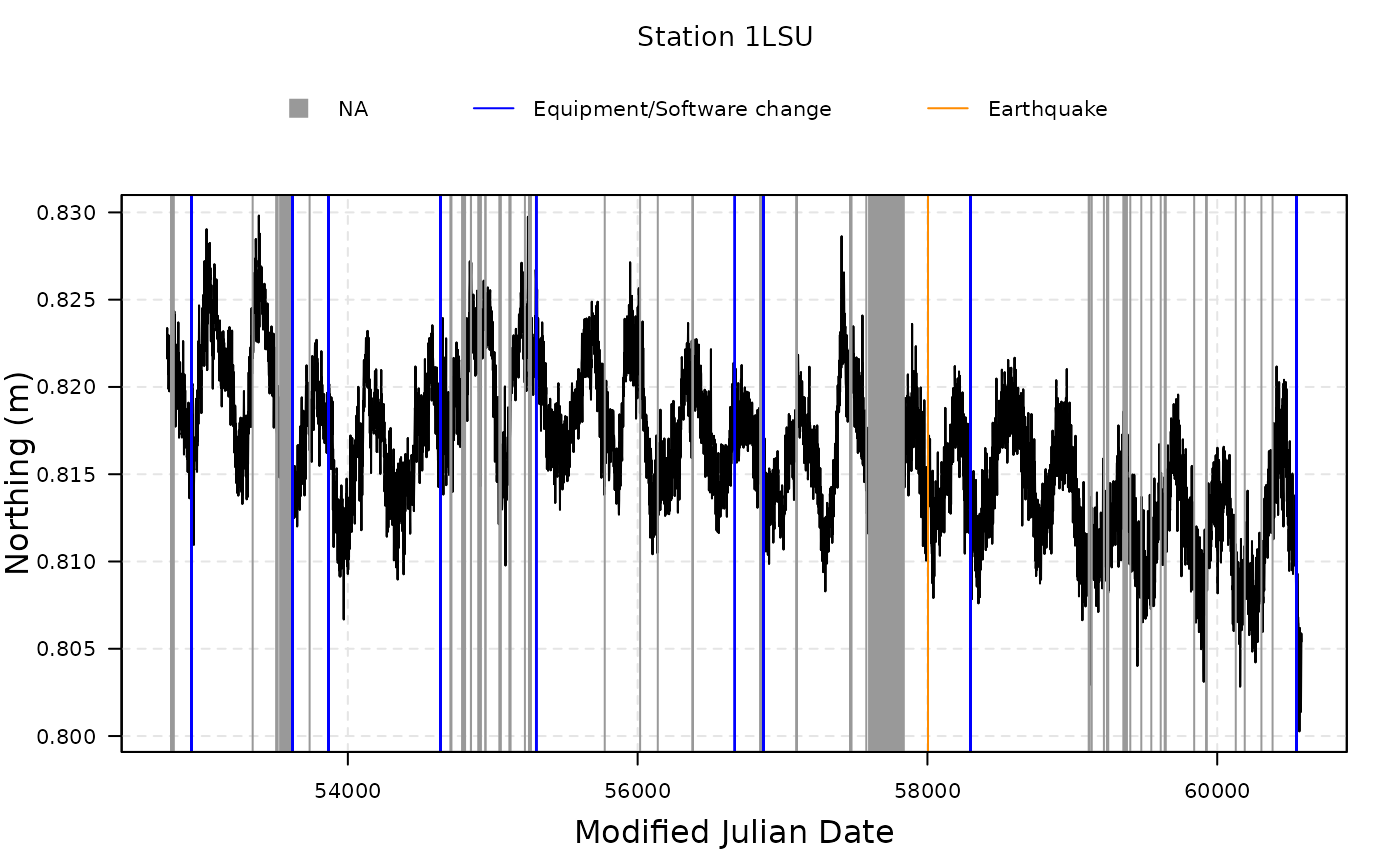
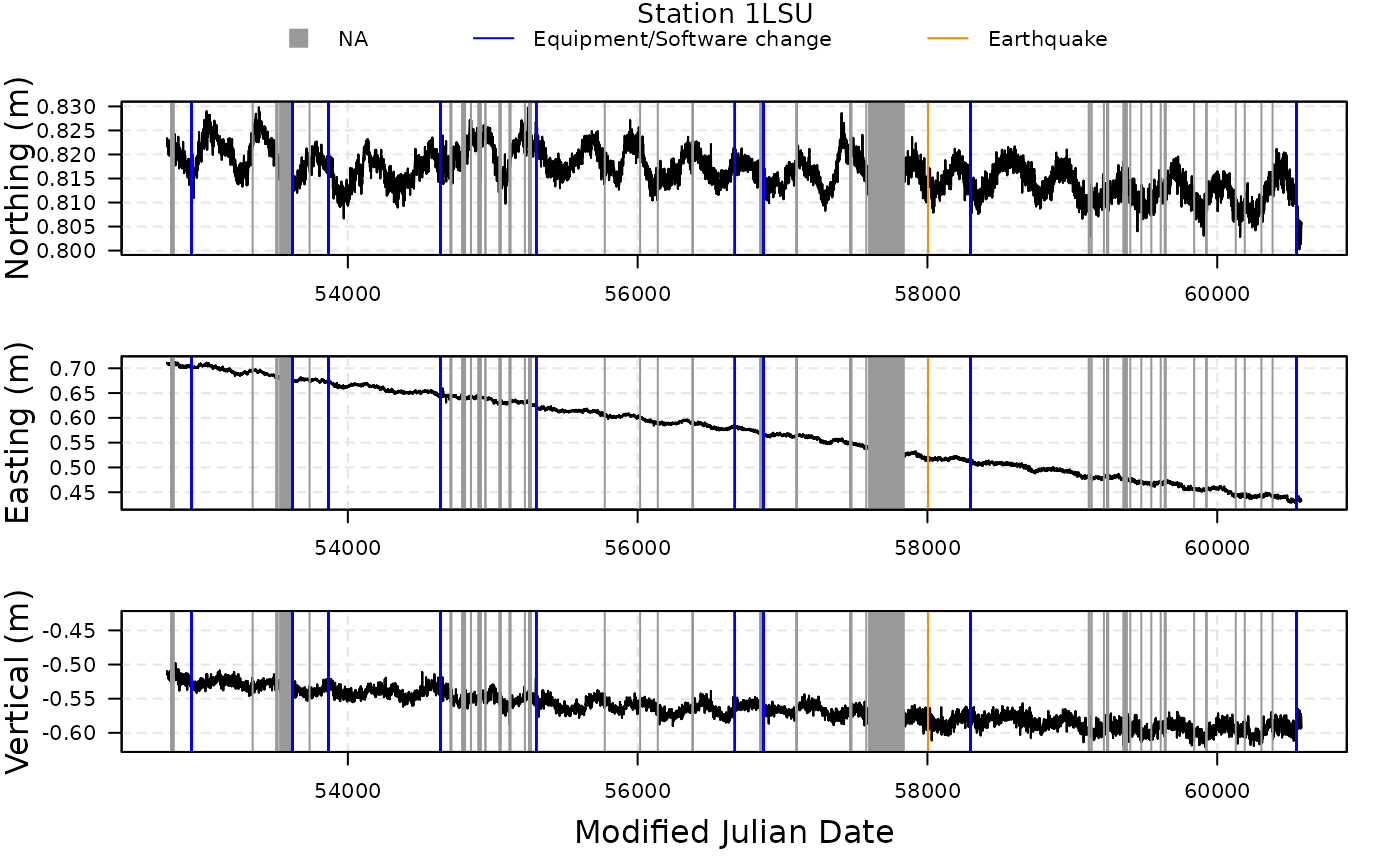 plot(station_1LSU, component = "N")
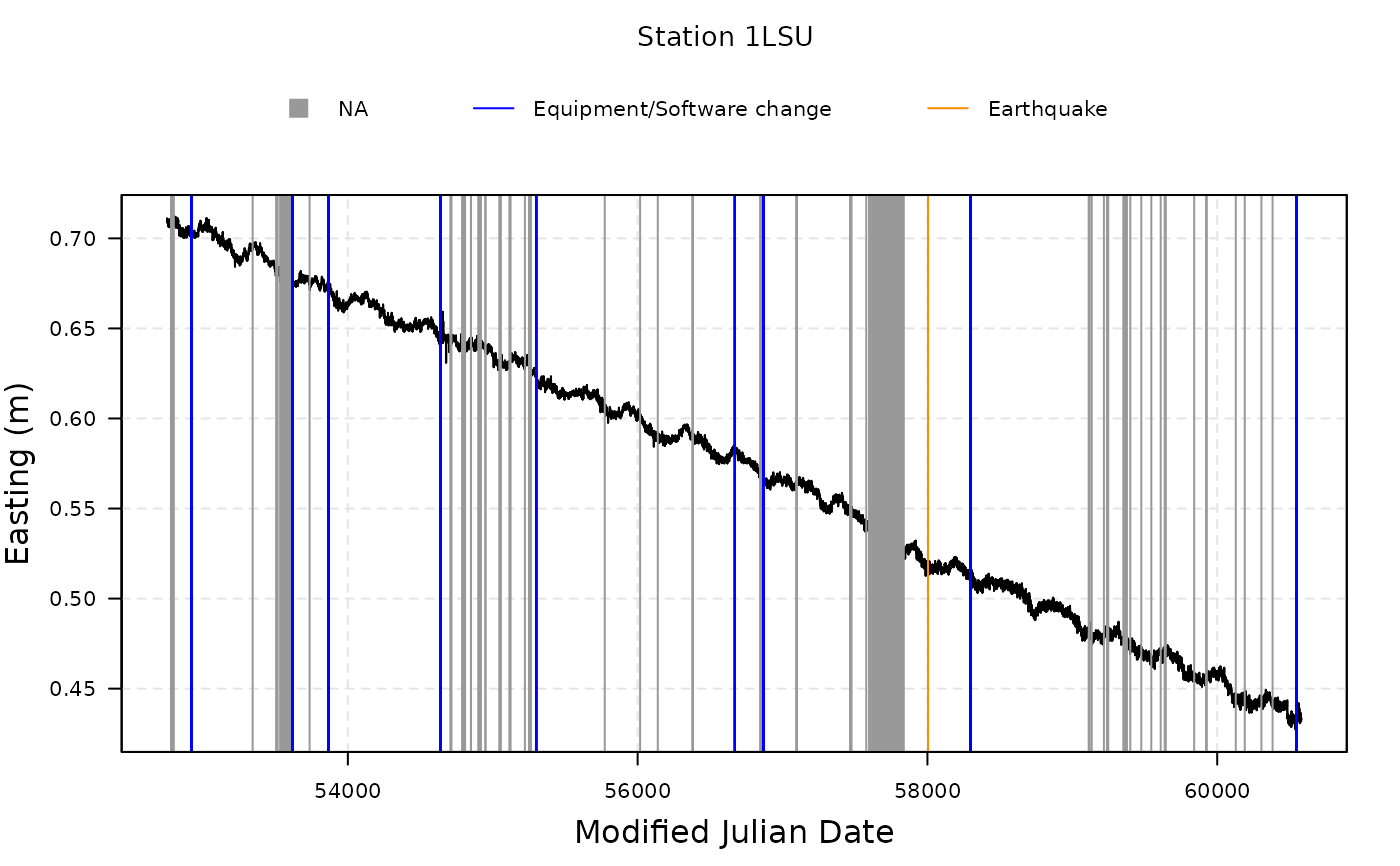
 plot(station_1LSU, component = "E")
 plot(station_1LSU, component = "V")