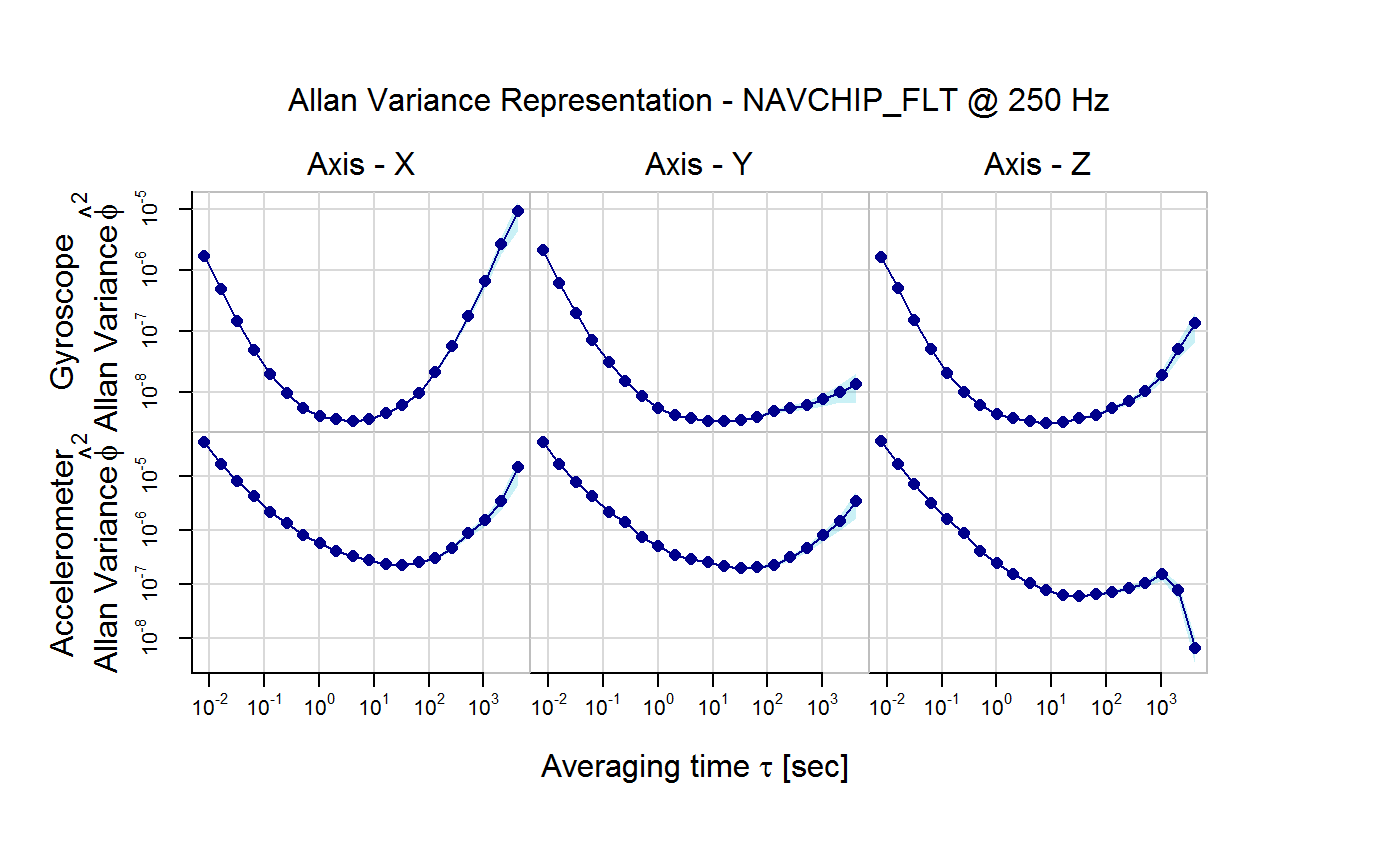
Displays a plot of Allan variance based on IMU data with its corresponding pointwise confidence intervals.
# S3 method for imu_avar
plot(x, xlab = NULL, ylab = NULL, main = NULL,
  col_ad = NULL, col_ci = NULL, nb_ticks_x = NULL,
  nb_ticks_y = NULL, ci_ad = NULL, point_pch = NULL,
  point_cex = NULL, ...)
Arguments
| x | An |
|---|---|
| xlab | A |
| ylab | A |
| main | A |
| col_ad | A |
| col_ci | A |
| nb_ticks_x | An |
| nb_ticks_y | An |
| ci_ad | A |
| point_pch | A |
| point_cex | A |
| ... | Additional arguments affecting the plot. |
Value
A plot of the Allan deviation and relative confidence interval for each scale.