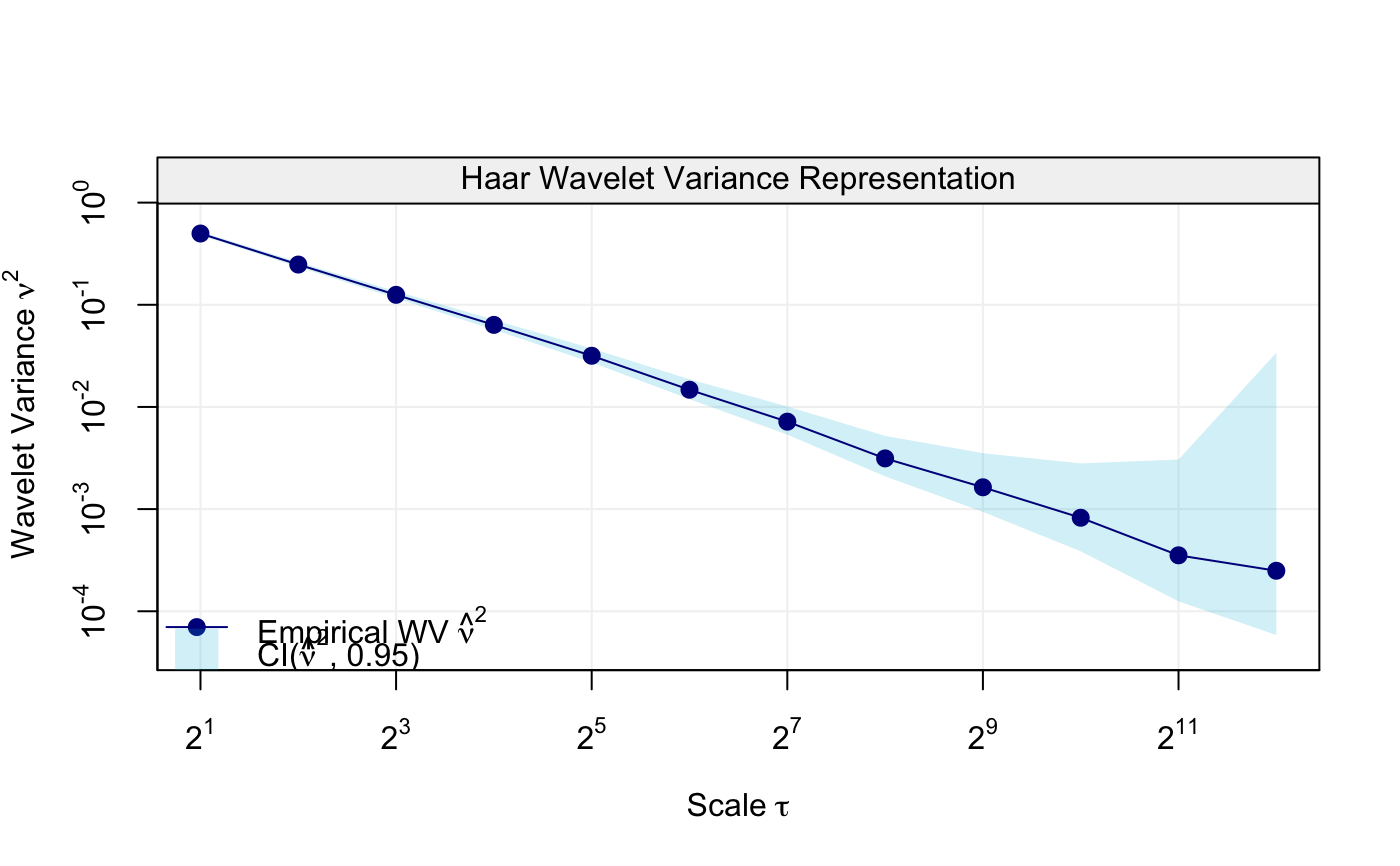
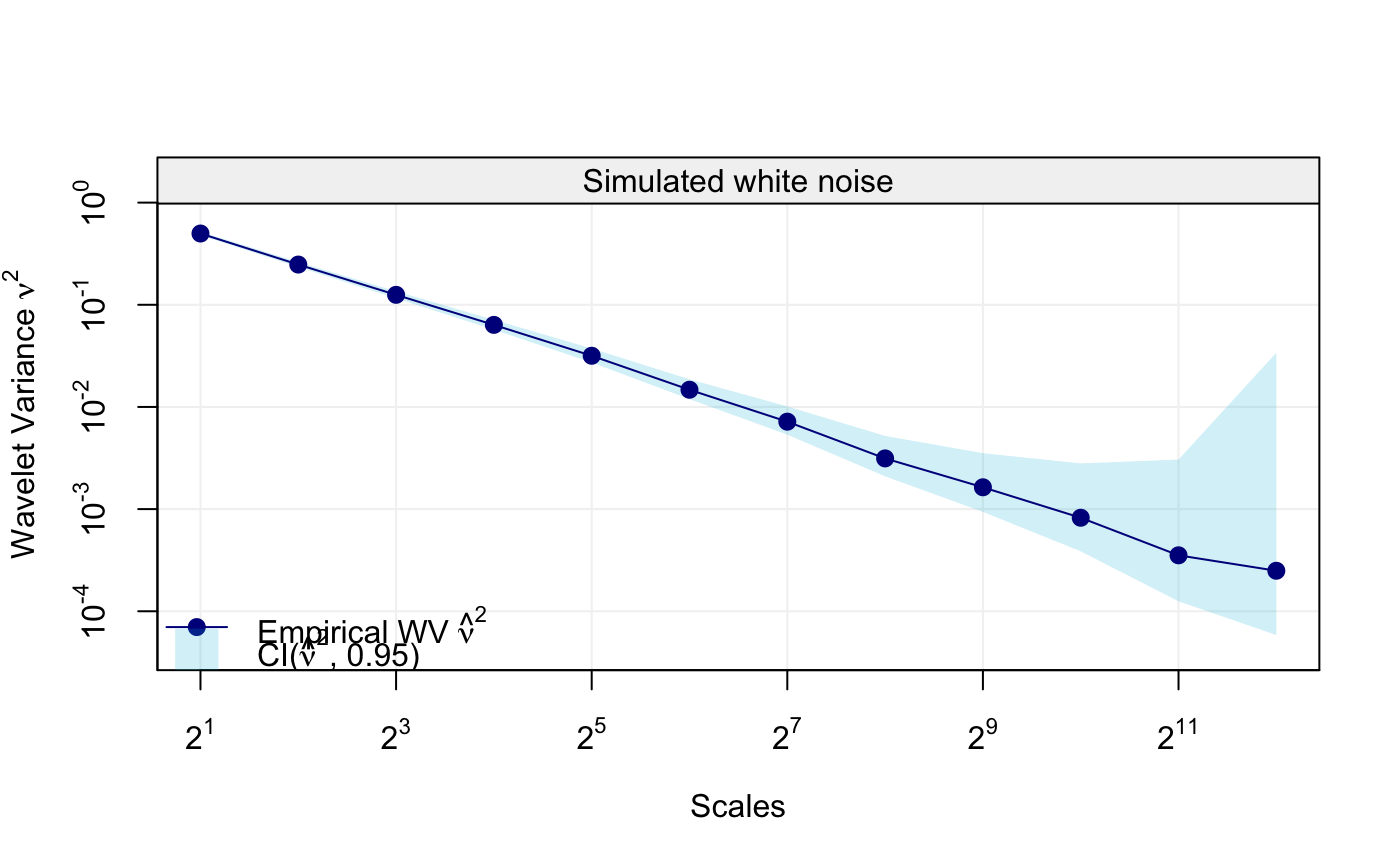
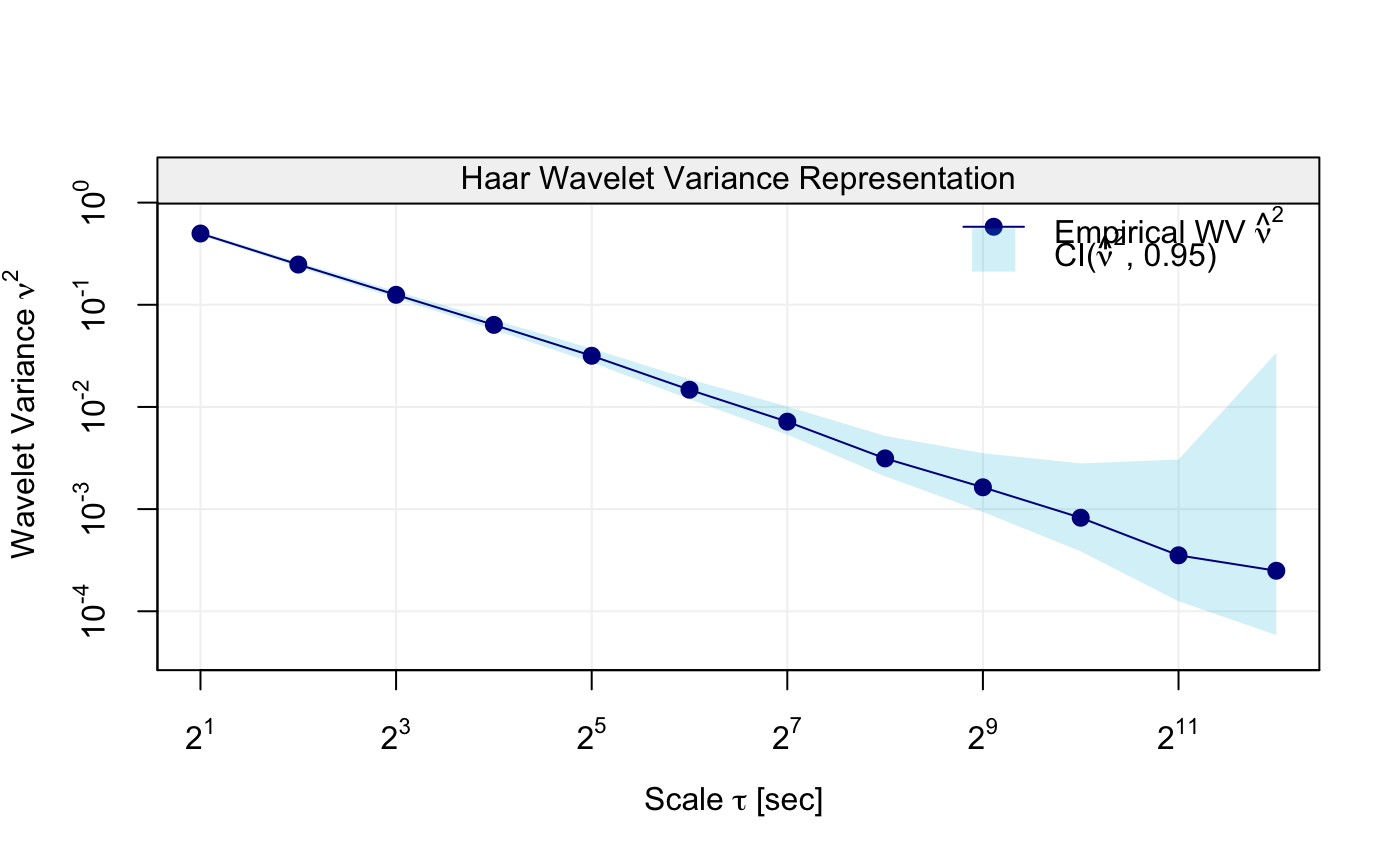
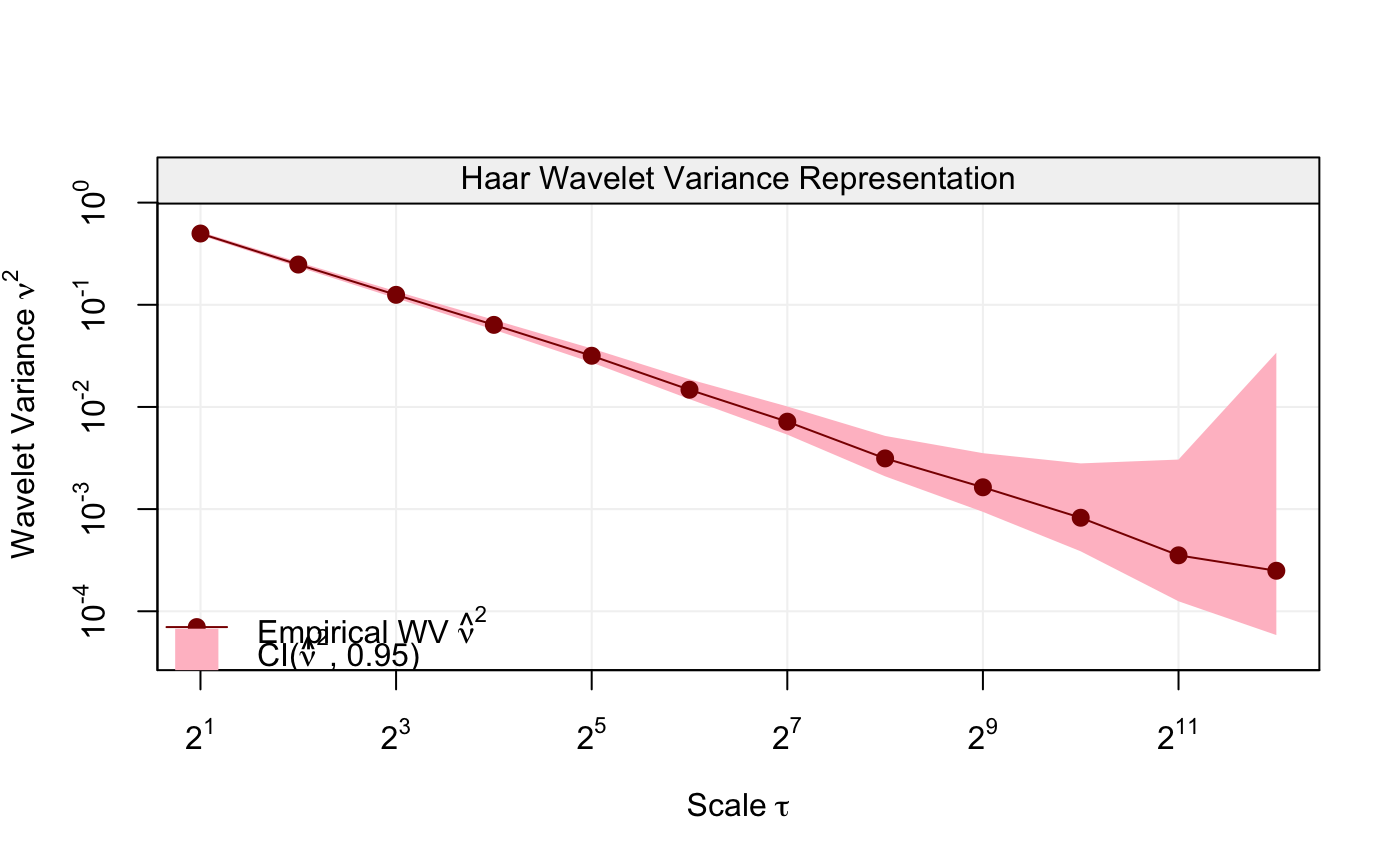
Displays a plot of the wavelet variances (classical and robust) for a given time series accounting for CI values.
robust_eda(
  x,
  eff = 0.6,
  units = NULL,
  xlab = NULL,
  ylab = NULL,
  main = NULL,
  col_wv = NULL,
  col_ci = NULL,
  nb_ticks_x = NULL,
  nb_ticks_y = NULL,
  legend_position = NULL,
  ...
)
Arguments
- x
A time series objects.
- eff
An
integerthat specifies the efficiency of the robust estimator.- units
A
stringthat specifies the units of time plotted on the x axis.- xlab
A
stringthat gives a title for the x axis.- ylab
A
stringthat gives a title for the y axis.- main
A
stringthat gives an overall title for the plot.- col_wv
A
stringthat specifies the color of the wavelet variance line.- col_ci
A
stringthat specifies the color of the confidence interval shade.- nb_ticks_x
An
integerthat specifies the maximum number of ticks for the x-axis.- nb_ticks_y
An
integerthat specifies the maximum number of ticks for the y-axis.- legend_position
A
stringthat specifies the position of the legend (uselegend_position = NAto remove legend).- ...
Additional arguments affecting the plot.
Value
Plot of wavelet variance and confidence interval for each scale.