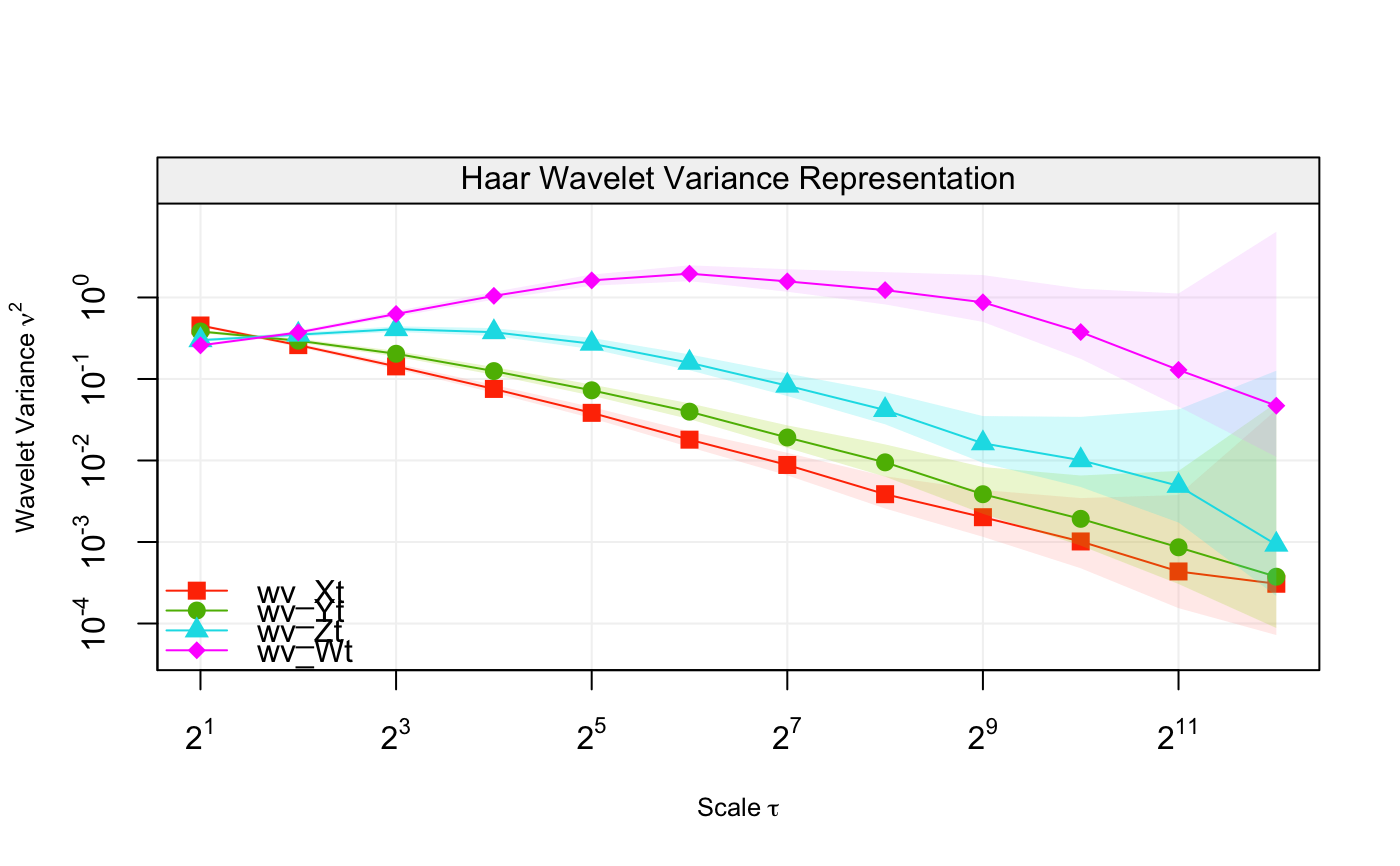
Displays plots of multiple wavelet variances of different time series accounting for CI values.
compare_wvar(
  ...,
  split = FALSE,
  add_legend = TRUE,
  units = NULL,
  xlab = NULL,
  ylab = NULL,
  main = NULL,
  col_wv = NULL,
  col_ci = NULL,
  nb_ticks_x = NULL,
  nb_ticks_y = NULL,
  legend_position = NULL,
  ci_wv = NULL,
  point_cex = NULL,
  point_pch = NULL,
  names = NULL,
  cex_labels = 0.8,
  x_range = NULL,
  y_range = NULL
)
Arguments
- ...
One or more time series objects.
- split
A
booleanthat, if TRUE, arranges the plots into a matrix-like format.- add_legend
A
booleanthat, if TRUE, adds a legend to the plot.- units
A
stringthat specifies the units of time plotted on the x axes. Note: This argument will not be used if xlab is specified.- xlab
A
stringthat gives a title for the x axes.- ylab
A
stringthat gives a title for the y axes.- main
A
stringthat gives an overall title for the plot.- col_wv
A
stringthat specifies the color of the wavelet variance lines.- col_ci
A
stringthat specifies the color of the confidence interval shade.- nb_ticks_x
An
integerthat specifies the maximum number of ticks for the x-axis.- nb_ticks_y
An
integerthat specifies the maximum number of ticks for the y-axis.- legend_position
A
stringthat specifies the position of the legend (uselegend_position = NAto remove legend).- ci_wv
A
booleanthat determines whether confidence interval polygons will be drawn.- point_cex
A
doublethat specifies the size of each symbol to be plotted.- point_pch
A
doublethat specifies the symbol type to be plotted.- names
A
stringthat specifies the name of the WVAR objects.- cex_labels
A
doublethat specifies the magnification of the labels (x and y).- x_range
A
vectorthat specifies the range of values on the x axis (default NULL).- y_range
A
vectorthat specifies the range of values on the y axis (default NULL).