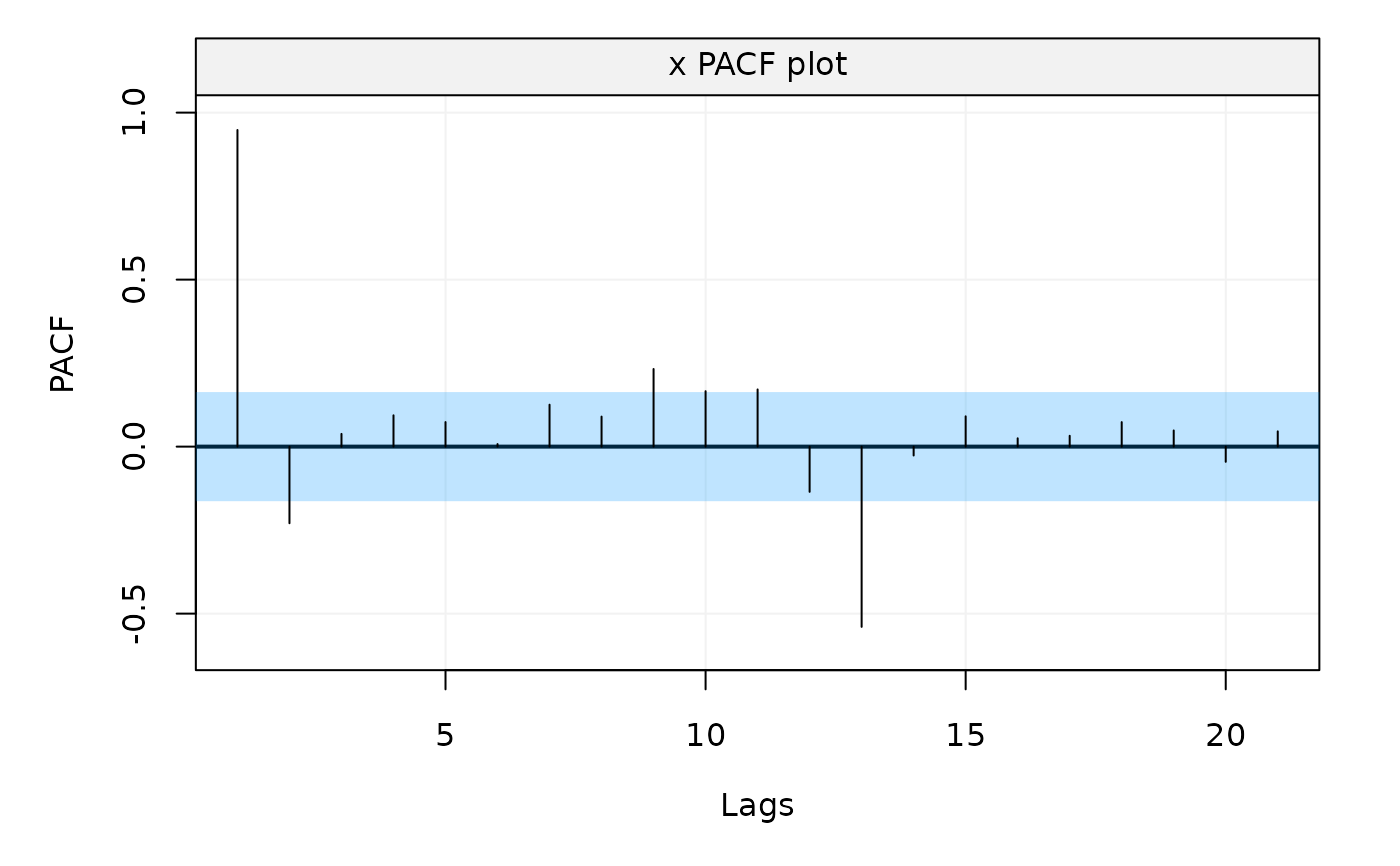
The function plots the output of the theo_pacf and auto_corr functions (partial autocovariance or autocorrelation functions).
# S3 method for PACF
plot(
  x,
  xlab = NULL,
  ylab = NULL,
  show.ci = TRUE,
  alpha = NULL,
  col_ci = NULL,
  transparency = NULL,
  main = NULL,
  parValue = NULL,
  ...
)
Arguments
- x
- xlab
A
stringindicating the label of the x axis: the default name is 'Lags'.- ylab
A
stringindicating the label of the y axis: the default name is 'PACF'.- show.ci
A
boolindicating whether to show the confidence region. Defaults toTRUE.- alpha
A
doubleindicating the level of significance for the confidence interval. By defaultalpha = 0.05which gives a 1 -alpha= 0.95 confidence interval.- col_ci
A
stringthat specifies the color of the region covered by the confidence intervals (confidence region).- transparency
A
doublebetween 0 and 1 indicating the transparency level of the color defined incol_ci. Defaults to 0.25.- main
A
stringindicating the title of the plot. Default name is "Variable name PACF plot'.- parValue
A
vectordefining the margins for the plot.- ...
Additional parameters
Examples
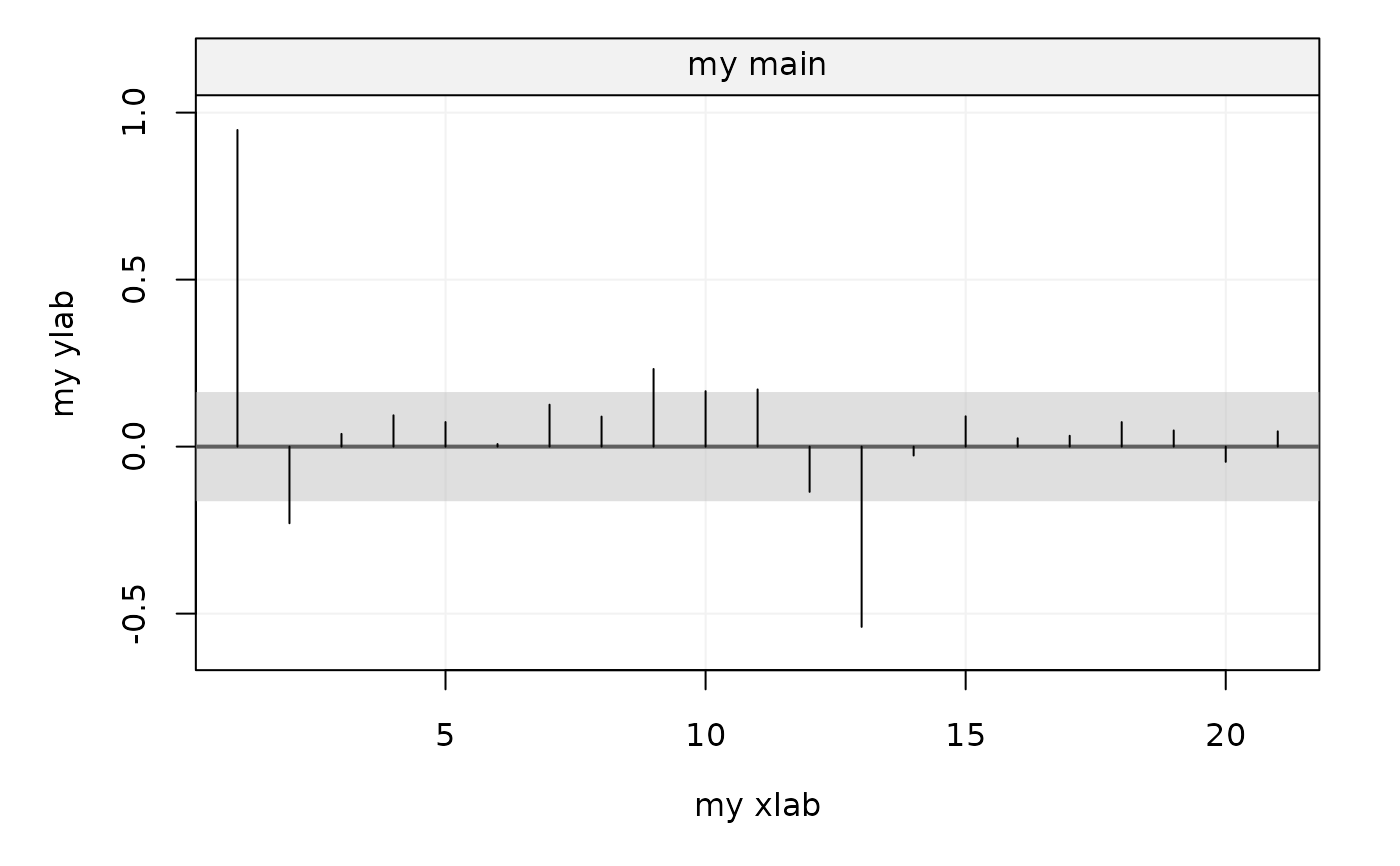
# Plot the Partial Autocorrelation
m = auto_corr(datasets::AirPassengers, pacf = TRUE)
plot(m)


# More customized CI
plot(m, xlab = "my xlab", ylab = "my ylab", show.ci = TRUE,
alpha = NULL, col_ci = "grey", transparency = 0.5, main = "my main")
# More customized CI
plot(m, xlab = "my xlab", ylab = "my ylab", show.ci = TRUE,
alpha = NULL, col_ci = "grey", transparency = 0.5, main = "my main")