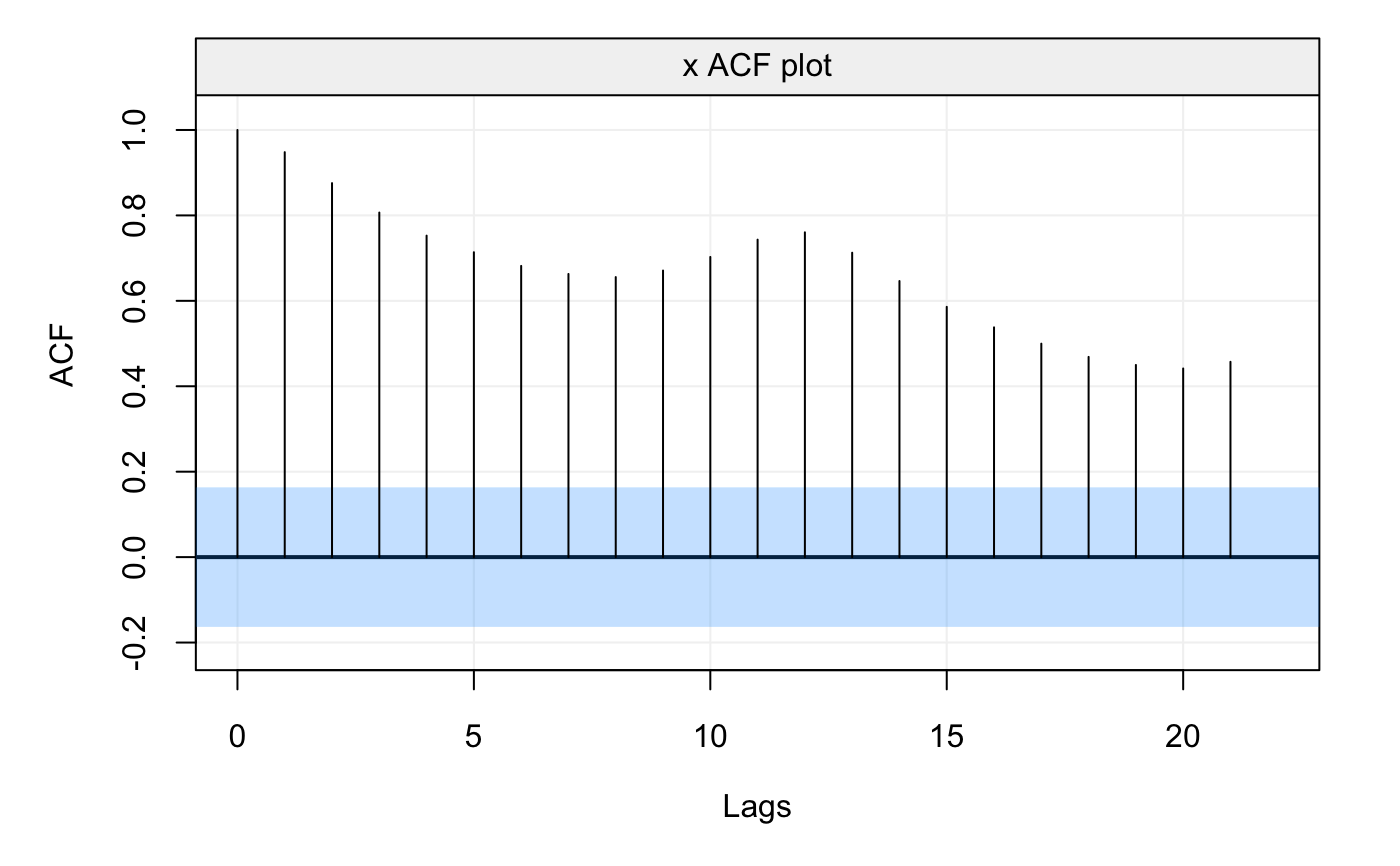
The function plots the output of the theo_acf and ACF functions (autocovariance or autocorrelation functions).
# S3 method for ACF
plot(x, xlab = NULL, ylab = NULL, show.ci = TRUE,
  alpha = NULL, col_ci = NULL, transparency = NULL, main = NULL,
  parValue = NULL, ...)
Arguments
| x | An |
|---|---|
| xlab | A |
| ylab | A |
| show.ci | A |
| alpha | A |
| col_ci | A |
| transparency | A |
| main | A |
| parValue | A |
| ... | Additional parameters |
Examples
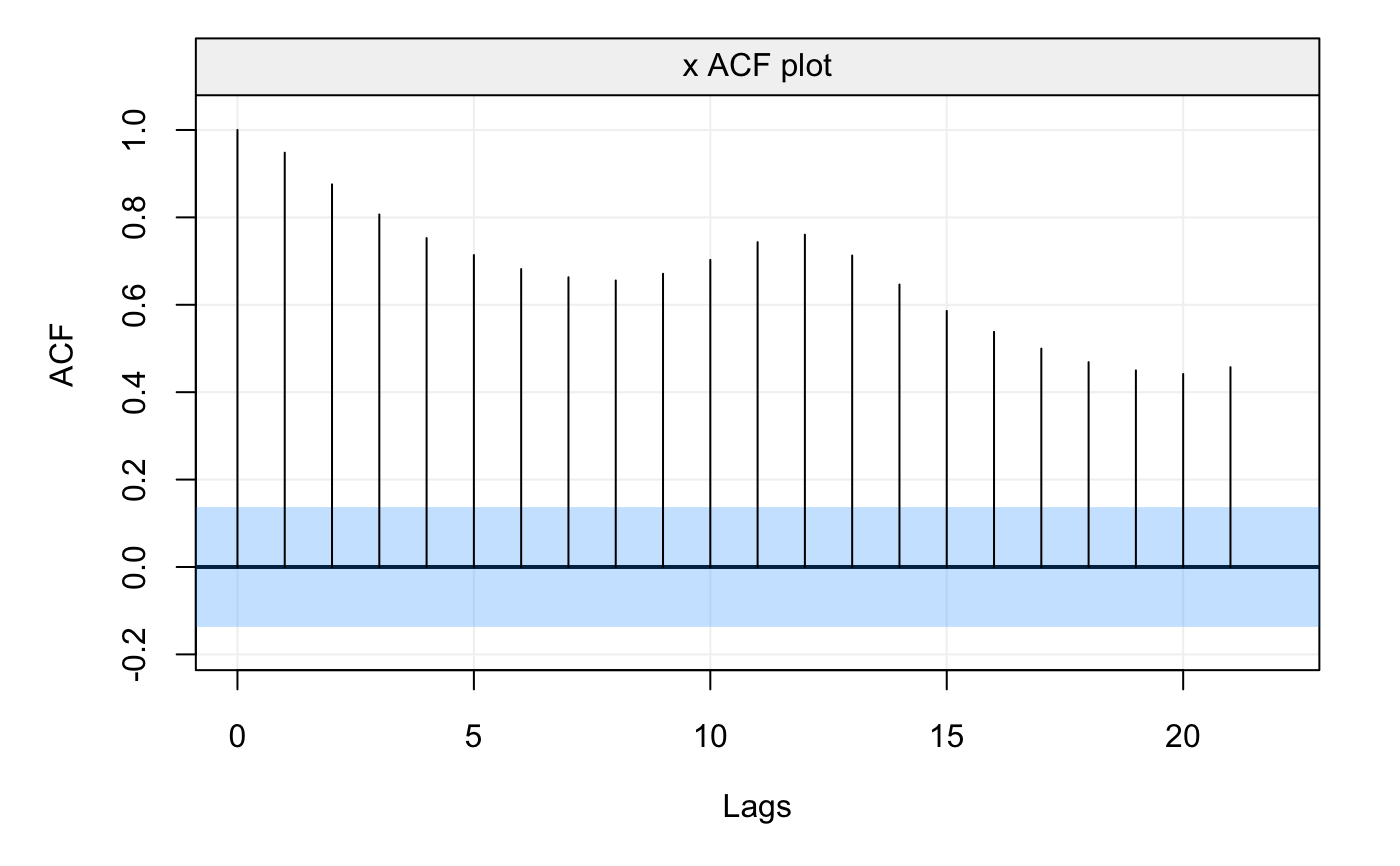
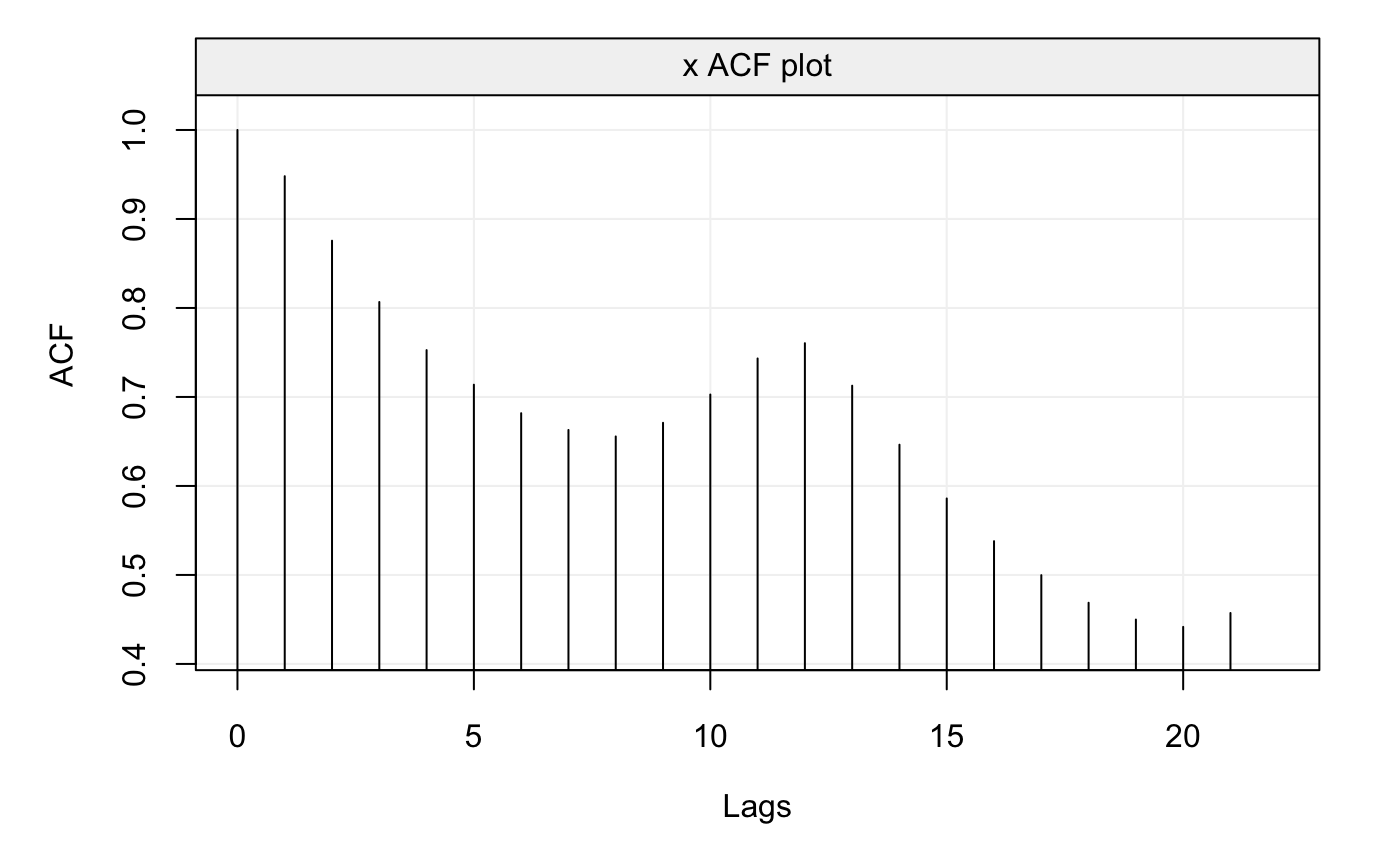
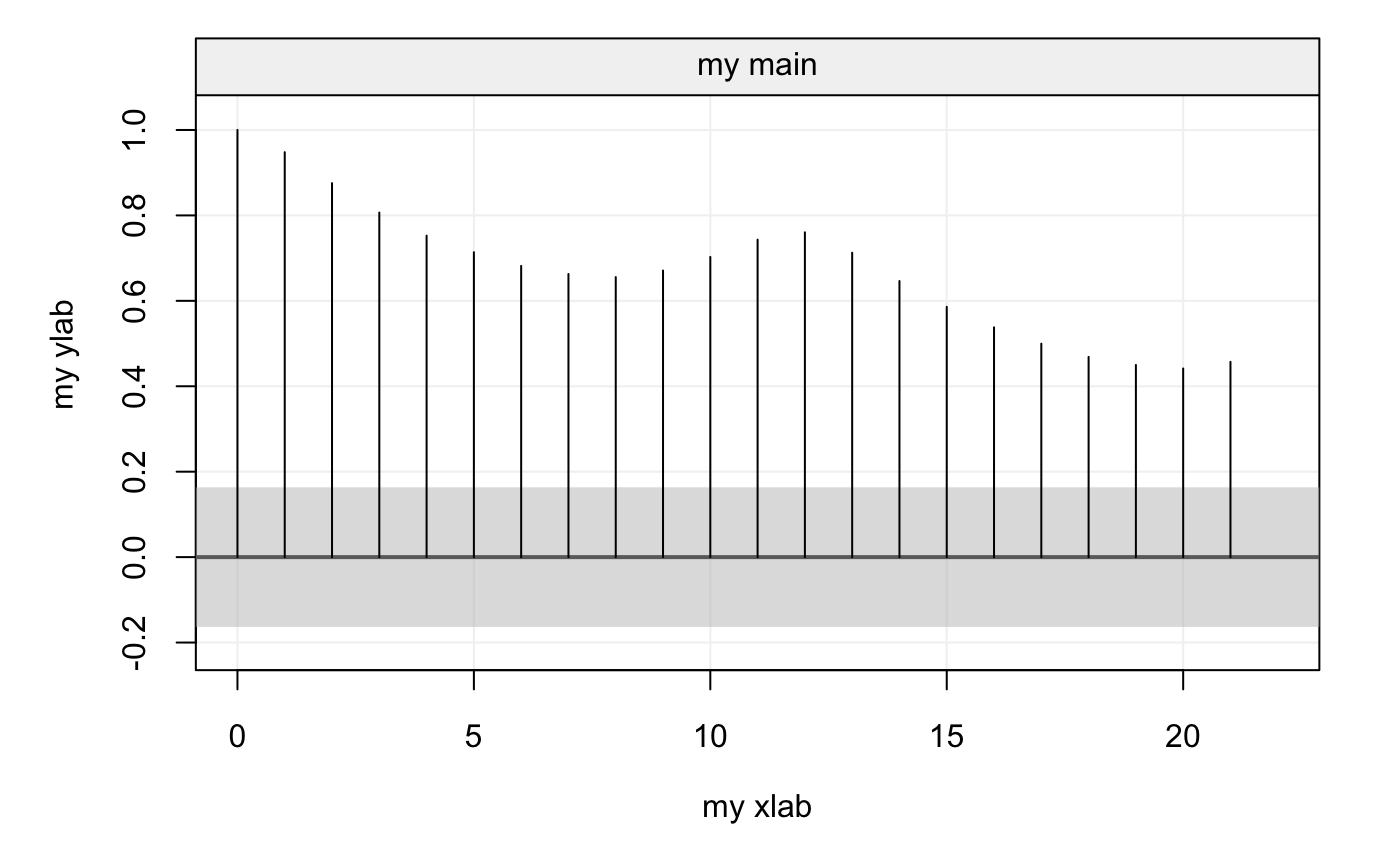
# Plot with 90% CI plot(m, alpha = 0.1)# Plot without 95% CI plot(m, show.ci = FALSE)# More customized CI plot(m, xlab = "my xlab", ylab = "my ylab", show.ci = TRUE, alpha = NULL, col_ci = "grey", transparency = 0.5, main = "my main")