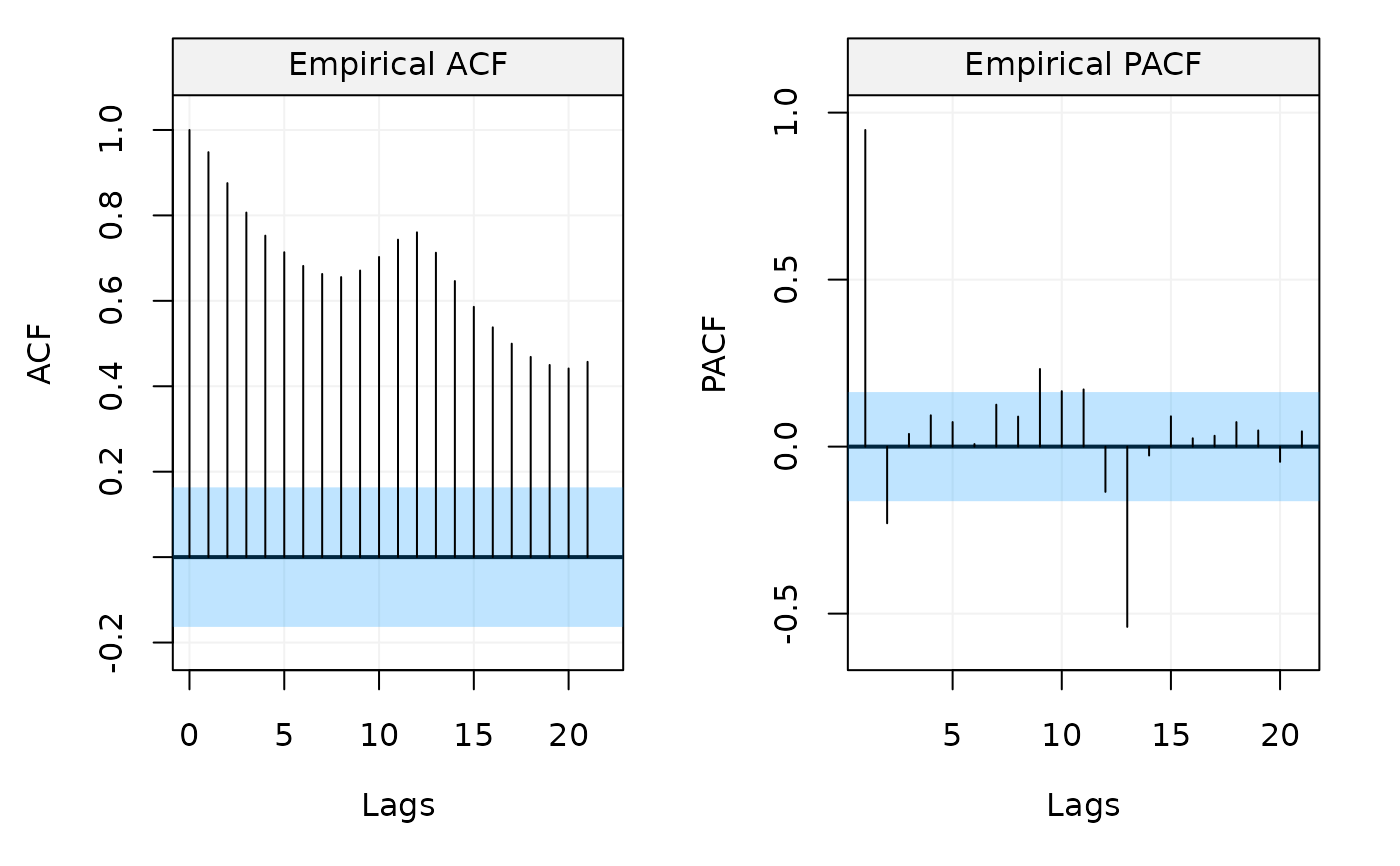
Correlation Analysis function computes and plots both empirical ACF and PACF of univariate time series.
corr_analysis(
  x,
  lag.max = NULL,
  type = "correlation",
  demean = TRUE,
  show.ci = TRUE,
  alpha = 0.05,
  plot = TRUE,
  ...
)
Arguments
- x
A
vectoror"ts"object (of length \(N > 1\)).- lag.max
A
integerindicating the maximum lag up to which to compute the ACF and PACF functions.- type
A
characterstring giving the type of acf to be computed. Allowed values are "correlation" (the default) and "covariance".- demean
A
boolindicating whether the data should be detrended (TRUE) or not (FALSE). Defaults toTRUE.- show.ci
A
boolindicating whether to compute and show the confidence region. Defaults toTRUE.- alpha
A
doubleindicating the level of significance for the confidence interval. By defaultalpha = 0.05which gives a 1 -alpha= 0.95 confidence interval.- plot
A
boolindicating whether a plot of the computed quantities should be produced. Defaults toTRUE.- ...
Additional parameters.
Value
Two array objects (ACF and PACF) of dimension \(N \times S \times S\).
Examples
# Estimate both the ACF and PACF functions
corr_analysis(datasets::AirPassengers)